
From follower counts to post engagement percentages, the world of social media metrics can be confusing to wade into. On top of that, a new important metric seems to be created on a weekly basis.
What should you be tracking? Is it even important for your business? In this guide, we’ll take you through the most basic metrics that every company should be paying attention to based on your goals. These are generalized across social media channels. The names of key metrics can vary from one channel to another, but we’ll cover the core measurements that you’ll want to stay on top of for your KPIs, goal setting and campaign tracking.
In this guide, we’ll go over what social media metrics are, why they’re important, how to find them and which ones you should be paying attention to. Specifics that you track will vary by industry, business and campaigns. Consider these as the basic metrics to build your approach to social media analytics around.
What are social media metrics and why should you track them?
Your social media goals are what determine your metrics. For every goal, you need a related metric, which will help determine if your social strategy is hitting the mark or not.
For example, your business goal may be to increase conversions. Therefore, your social media goal becomes increasing conversions from those that visit your site via posts that are part of your strategy. Now that you have a goal in mind, you can clearly identify which social media metrics to measure and a time frame in which to measure them. For example, increasing conversions from social by 25% in a three-month span. To meet this goal, you decide to run a campaign that will include ads, product tags and influencers. To measure this, you determine that you’ll look at the social traffic and conversion rate metric from those posts in your website analytics.
Social media metrics are important because they prove you can measure how successful a campaign is, how well your social strategy is performing, and ultimately if you will have an impact on your overall business. Not only does having these metrics give you an opportunity to showcase the impact of your work to executives, but providing consistent social media metric reports can lead to major shifts for your social team, including budget increases and increased access to resources. And last but certainly not least, metrics keep you aware of general social profile and brand health – you don’t know the impact of your social media presence until you have the data to back it up.
Measuring the right social media metrics
Every social media platform has its own native analytics for you to dive into. For Facebook, you’ll find them in the Insights tab. In Twitter, you navigate to Twitter Analytics. In Instagram and Pinterest, you’ll need business accounts before you’ll be able to see your data.
If you’re just starting out and have a low budget, visiting these native analytics resources individually can be a good starting point.
In order to minimize the time investment of pulling metrics from all these sources, find a social media analytics tool that fits within your budget and needs. The time you save on manually creating reports and pulling together different networks’ data will more than make up for the money you spend on these tools.

In Sprout, all plans come with presentation-ready social media reports, filterable by platform and date. This means customized graphs and comparisons to a previous date range are all easily accessible to you and easy to surface up to team leaders and executives.
Whichever route you take, it’s essential to monitor and document your metrics somewhere on a consistent basis and track your progress toward your goals.
Now that you know your goals and how to get your data, narrowing down metrics in a sea of options can be a challenge. Social data is so vast. We’ve used conversions as one example. However, what about some of the fluffier metrics? How should you be using those? The answer is about tying the metrics back to your goals. If you’re looking to drive awareness through publishing, how many impressions are you driving? If you’re looking to build a community, how many people do your posts engage on average? All metrics have meaning, it’s about interpreting what that metric tells you and translating that back to your business goals.
Engagement: Likes, comments, shares and clicks
Engagement is a big umbrella category to track. It essentially boils down to how much audience accounts are interacting with your account and how often. Every network will have some sort of engagement metric that is a total sum of smaller engagement metrics such as likes, comments, and shares and many of them have more than one type of metric, or different naming conventions, such as Retweets vs. Shares.
High engagement rates will indicate audience health (how responsive your audience is and how many are “real” followers), interesting content types and your awareness of your brand.
At the granular level, you’ll look at different engagement metrics:
- Likes, Comments, Retweets, etc.: Individual engagement metrics like a Share or a Retweet add up. In a Twitter report, you’ll see a total number of engagements per post or profile.
- Post engagement rate: The number of engagements divided by impressions or reach. A high rate means the people who see the post find it interesting.
- Account mentions: Organic mentions, like @mentions that aren’t part of a reply, or tagging a brand in an Instagram story without prompting, indicate good brand awareness.
Like most metrics, looking at one engagement metric might not give you all the context you need to make full decisions for your strategy. Looking at a combination of metrics is a great way to learn more about what levers you can pull to meet your specific goals. For example, a post that receives a lot of likes but not comments or shares isn’t always bad. The post intention could’ve been to present a beautiful image and a caption that isn’t meant to be a call to action. But, if there was a call to action that encouraged comments and shares, then the lack of them could mean a poorly performing caption.

Looking at the full picture is great as your devising your strategy, but keeping a close eye on one metric in particular can really help you be more agile and pivot your strategy quickly. Sprout’s Sent Message Performance report will break down each post’s metrics but also provide an average or total at the top of each column. By sorting these, you’ll find out which posts receive the most impressions and which have the most average users engaged. If engagement is your goal, sorting by the most engaged posts will help you find similarities among these posts, so you can determine which elements of these posts appeal most to people and optimize your future content.
Awareness: Impressions & reach
Frequently used but often confused, impressions and reach are each an important metric to track, especially if your goals for social are focused around brand awareness and perception.
If you’re using these metrics as benchmarks for your brand, it’s important to understand the difference between reach and impressions.
At the post level:
- Impressions are how many times a post shows up in someone’s timeline
- Reach is the potential unique viewers a post could have (usually your follower count plus accounts that shared the post’s follower counts).

While impressions can tell you a lot about the potential your content has for visibility on social on it’s own, it’s still important to look at other metrics for ultimate performance context. If you have multiple goals of both increasing awareness but also of educating your audience, you’ll likely want to look for a combination of both impressions and engagement. For a post that has a high impressions count but a low engagement number (and therefore a low engagement rate), it likely means that your post wasn’t interesting enough for audiences to take action after seeing it in their feed. For a post with a high reach count and high engagement rate, it’ll likely mean that the content went viral via Retweets and Shares.
In this example, the Tweet has a very high Reach because it has over 50k Retweets. To calculate the reach, we would need to add up every account that Retweeted it and their follower counts. The engagement rate is also high: it has thousands of Replies, Retweets, Likes, etc. The analytics we can’t see from the public view would include clicks to expand the Tweet, Quote-Retweets and profile visits. However, even from what we can see publicly, this is a wildly successful Tweet.
Share of voice: Volume and sentiment
Share of voice is a metric often used in public relations, or as part of a competitive analysis or paid advertising campaign. It indicates how much of the online sphere your brand is taking part in. For example, if you’re a florist in Toronto, it would look like how many people are talking about your brand online as compared to your competitors.


Sprout’s listening features help you understand the volume of discussion for certain keywords. Combined with a Trends report, you’ll be able to see what’s most often associated with your brand and where you can improve or capture more attention.
Improving your share of voice is likely an ongoing goal, one that you measure by benchmarking over time. Campaigns come and go, but your brand is forever. Unless you’re the only company in your field, you won’t always be able to maintain the biggest share of voice but you can keep track of how it ebbs and flows over time and consider the factors for those changes.
ROI: Referrals & conversions
The easiest example of an important social metric and our first example of this article. Most applicable for companies with websites or e-commerce platforms, social referral traffic and conversions are tied to both sales and marketing goals, and ultimately major business goals. To track these, you’ll need a publishing strategy that incorporates UTM tracking and a website traffic analytics program like Google Analytics or a built-in one if you’re on an e-commerce platform like Shopify.

In Sprout, you can link your Google Analytics account and it’ll display the traffic sources and any Twitter mentions that have a link to your site.
Referrals are how a user lands on your website. In web analytics, you’ll see them broken down into sources. “Social” is usually the source/medium you’ll be monitoring, and then it’s broken down by network.
Conversions is when someone purchases something from your site. A social conversion means they visited via a social media channel and then purchased something in that same visit.
Hand in hand with referrals and conversions is the click-through rate (CTR) in ads and posts. A high CTR means an effective ad. Note that CTRs differ wildly across industries, networks and content types. It’s best to research industry benchmarks beforehand and then monitor your ads and adjust accordingly.
Customer care: Response rate & time
We’ve been pretty focused on the performance of posts and social media accounts but what about your customer’s experience with your brand? Additionally, what about your own performance? Who’s watching the social media manager to make sure they’re doing their job well and that customers are being heard in a reasonable amount of time?
This is where metrics like response rate and response time come in. They track how fast your team is responding to important messages and how many of them are actually being responded to. For multi-user accounts, you should also track how much each person is getting done.
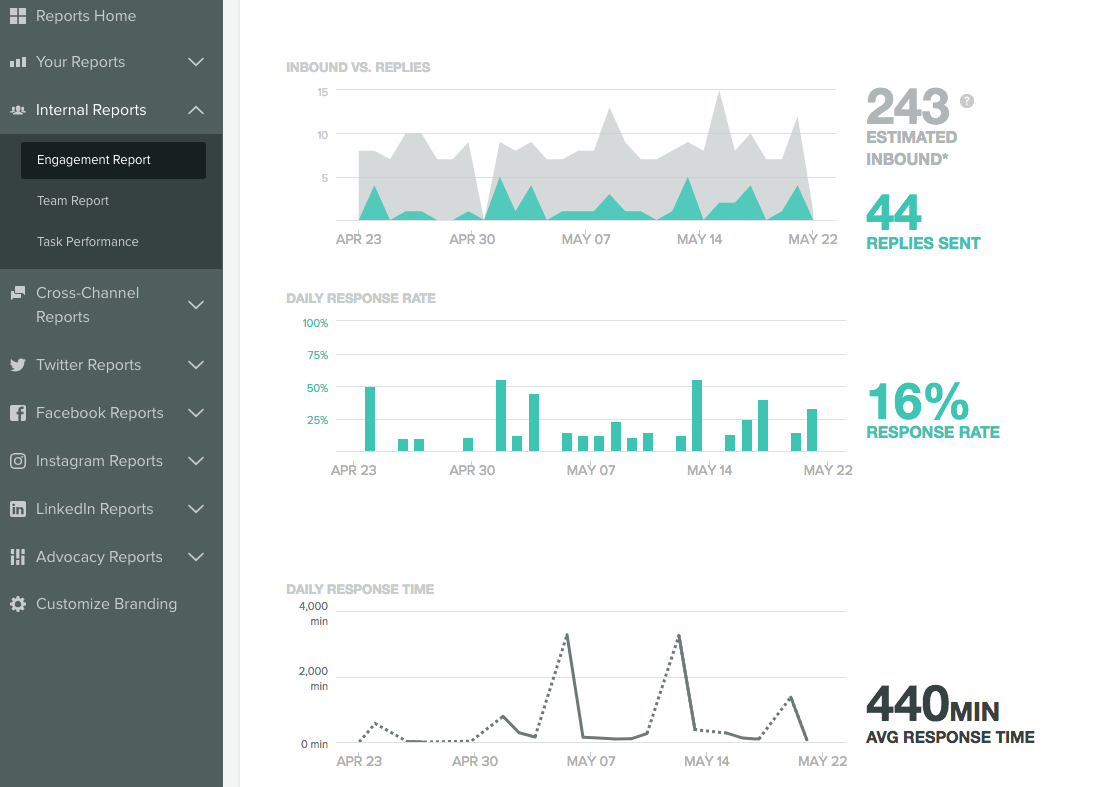
In the Sprout Engagement report, you’ll see a variety of metrics that include response rate and response rate, further broken down by day of week. If your social strategy goal is to respond to everything within six hours and the report says otherwise, then you’ll know what you need to work on.

The Sprout Team report shows the above metrics but sorted by team members. With these metrics, you’ll be able to see who’s exceeding the expected time to respond and whose published posts are receiving the most replies.
Conclusion
Among the dozens of social media metrics that are available to you to track, we’ve compiled the most essential ones that matter for most businesses and most goals. To recap, metrics are important because they tell if you a campaign or strategy is successful over time. You can find metrics in your native channel analytics’s section or through an all-in-one program like Sprout.
The most common and often important metrics to pay attention to are engagement, impressions and reach, share of voice, referrals and conversions and response rate and time. These combined will give you a 360º view of your social media performance. With time and new goals, you’ll add new and more nuanced metrics to make them more relevant to your business.
What social metrics do you consider key to your strategy? How have you tracked them over the course of your campaigns? Share with us @SproutSocial or in the comments!


